Soon after Google’s recent update about the manner in which impressions and average position are reported in the Google Search Console interface, seasoned webmasters had a trivial panic attack. Quite a handful number of clients at a renowned performance marketing agency saw drastic drops in average position after the update. Check this:

On July 13, 2017 Google confirmed the update:
An incremental improvement in Google’s logging system now provides better accounting for results in lower positions…
And included it in their Search Console Data Anomalies page.
Can you discern anything from the update? We guess not, because the update is quite vague, leaving a lot of room to search for answers about what really happened, what kind of changes took place and why the reports are so much different.
In this blog, we will formulate crucial insights based on a study conducted by a well-renowned research analyst firm pointing out why the change was so drastic and how the firm witnessed a significant increase in the total number of keywords reported per day.
What actually happened?
Owing to the limitations of regular GSC interface, the search engine experts resorted to the Search Analytics API to derive a complete data set in order to peep into from where the drop in average position was coming from. As they were already aware of all the standard engagement metrics of Impressions, CTR, Clicks, and Average Position, they decided to seek through another metric that might reveal them their desirable answers: the total number of unique queries pulled in with the API per day.
What the data revealed?
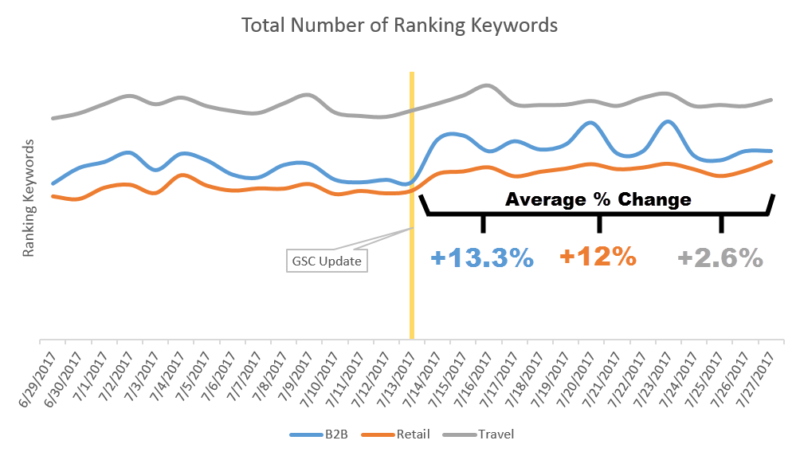
The highly skilled webmasters decided to select three sites from three different domains that were positioned closest to the median number of ranking queries per day across all the sites for which they stored Google Search Console (GSC) data.
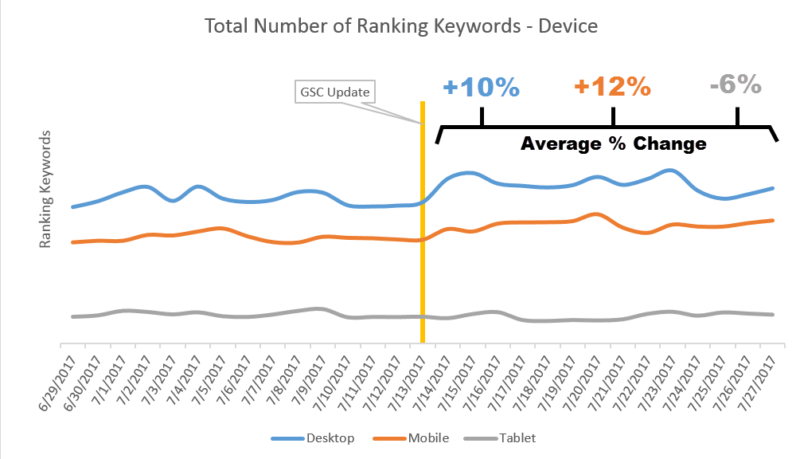
Out of three, two sites witnessed a prominent and consistent increase in the number of ranking keywords dragged from the API per day. In the third site, the average number of ranking queries per day increased post update, but the increase was ambiguous.

Interestingly, the analysts saw a slight decrease in the number of keywords extracted by the API per day for tablet devices: which signifies that though the average percent change was higher than predicted, the total change might not be that remarkable.

So, based on the given information that Google shared, the web-experts were able to come to an assumption: Google is now tracking low ranking keywords more significantly- which eventually drags down average position throughout the site.
Curiously, their data reveals something else:

While there’s been a crisp increase in the number of queries with an average position across the first page of results, one may also see a notable increase in the number of queries reported with ranks in position 10 or better.
On an average, the number of queries ranked in position 10 or better spiked up post the update by around 7.1 percent. On the other hand, the fair number of keywords from position 11 or more increased by about 7.8 percent.
